
At Tinkerbee we believe that data and information can really empower you and your business. Our mantra is #quantifiedEverything to #maximizeLife!
Nothing helps more than a nicely designed dashboard that helps literally ‘paint a picture’ of the state in which various parts of your business are in. That’s why we call our dashboard SenseSight.
We’ve now added a new clean and colorful visualizations upgrade to SenseSight. All responsive multi-device and lightweight, using pure CSS and some back-end code magic 🙂
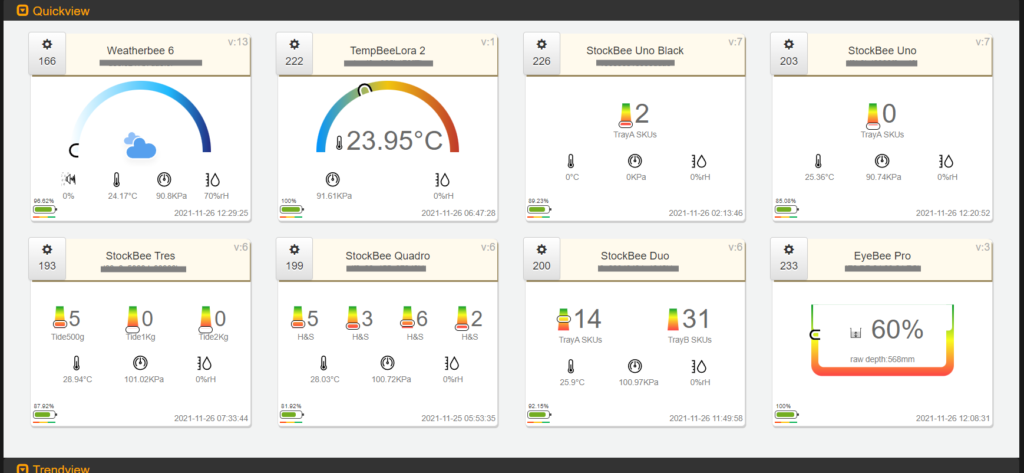
These QuickView boxes provide the latest data snapshots from our sensors. TrendViews on the other hand provide a graphical time-line view of sensor-data. Let us walk you through some of these:
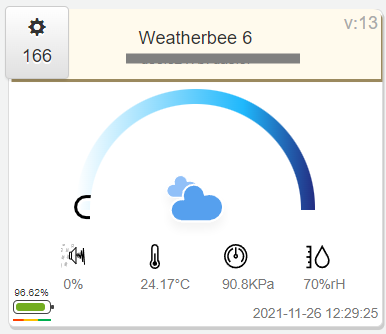
WeatherBee™ Quickview
On the top-left is the QuickView for WeatherBee. The focus data point is the hyper-local rain status shown through the plain cloud animation and the rainbow gauge on top with the pointer on the white end of the spectrum (indicating no-rain). Depending on the intensity of rain, the pointer could swing all the way to the right!
All secondary information is displayed on the second row and here it includes rain sound score, atmospheric temperature, atmospheric pressure and air-moisture. WeatherBee™ is used by any institution that needs hyperlocal real-time weather (especially rain) to fine tune and customize their customer offering for the locality. The real time information can also be paired with macro weather data and predictions based on satellite data (available through other independent sources).
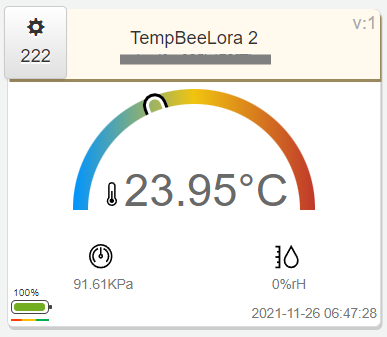
TempBee™ Quickview
Next up is TempBee. TempBee™ is used in the following situations:
a. Cold storage units to monitor vaccines, medicines
b. Frozen food sections in the retail environment to ensure that ice-creams do not melt or get spoiled!
b. Rooms to show ambient temperatures and to monitor if aircon units are indeed working as they should!
The gradient rainbow gauge shows about 24 degree C in the green section indicating that the temperature is a comfy one! (This unit was used for ambient temperature in our office. Quite a nice weather now in Bengaluru!)
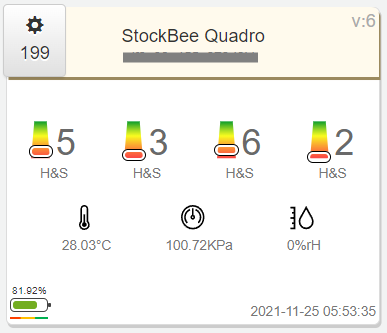
StockBee® Quickview
StockBees are smart-trays that can monitor how many units of any SKU (Stock Keeping Unit) are present on them at any time. They are used in retail and warehouse environments to track product movement off shelves in real-time to get valuable last mile insights and to avoid out-of-stock scenarios.
StockBee® units come in single, dual, triple or quadruple tray options to take care of situations where you may want to track multiple variants of a product kept adjacent on the same shelf. Eg. to compare customer interests in a 1Kg detergent vs a 500g pack.
The StockBee® dashboard comes with a linear visual scale representing full tray (if the pointer is all the way to the top green section) vs empty (when the pointer is in the red segment below) apart from showing the actual number of units estimated on it.
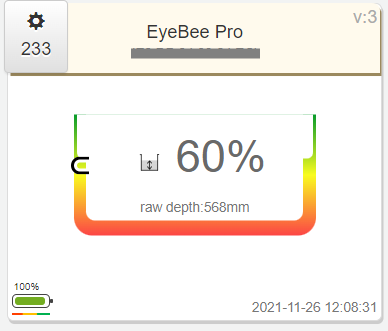
EyeBee® Quickview
The last visualization is for our first product EyeBee. EyeBee® is a depth monitoring device. It is used to monitor:
a. Content remaining / depleted in storage bins, barrels, vessels and tanks. Eg: fuel or cleaning fluids or garbage or water-tanks.
b. Water level in small streams/ canals.
Of course all of our products come with the ability to configure visualization parameters, even set up email alerts (eg: “Send an email as soon as content in bin A goes below 10%”) or even RESTful API integrations including simple web-hooks that get invoked every time there is new data for a device.
As always, please reach out to logesh.kc@tinkerbee.in to know more!