
Tinkerbees live:
482
SwitchBees:
2200
Data events handled:
4,425,802
As on April 25, 2024, 12 pm UTC
We wanted to track a few key metrics and display them reasonably real-time on our homepage (hosted on WordPress).
For a start, we wanted to simply track the number of devices that had gone live and the number of data-packets that our platform had handled.
For the first few months, I would run a couple of SQL queries on our database to get the metrics, then, edit and update the home page. Done. This was ok for a while and I did this only once a month.
Over time, we happened to host multiple application instances. So that meant running multiple SQL queries and then tabulating the results before manually updating the homepage (tinkerbee.in) with the new numbers. Not fun, but certainly a do-able, once a month exercise.
At one point in time we had over a thousand devices provisioned and the data payloads were increasing quite rapidly. Then a few months later had to de-activate one of our instances because a partner company no longer wanted to continue the project and that saw hundreds of devices get disabled overnight.
We then decided to look for a simple but a near real-time method to consolidate and display our stats.
The first attempt was a simple SQL select count query that was invoked every time there was a visit to our home-page. Evidently that didn’t last very long as we saw our database getting way too many hits for our comfort.
So we needed a solution that was:
a. Asynchronous (independent fetch, format and view)
b. Lightweight (if we need hourly queries, our database gets only 1 query per hour irrespective of the number of web-page hits)
c. Simple (require no additional libraries etc. works out of the box with linux, mysql etc)
So we decided on the following solution:
- Each server instance would query its stats at a defined frequency (eg: once an hour) and populate a dedicated stats table on each database with the latest cumulative counts and of course the timestamp.
This was implemented through a MySQL event.
An event looks something like this:
CREATE EVENTupdate_stats<event_name> ON SCHEDULE EVERY 1 HOUR STARTS <start date/ timestamp> ON COMPLETION PRESERVE ENABLE DO insert into <stats_table> <stats to be inserted> values (<select count a from b, select count c from d etc>) - Each server instance would also expose an API accessible only from the main server instance (tinkerbee.in) that would simply read from its stats table and return a json with the requested data (eg. latest number of devices, payload and the figures for month-1).
eg: GET https://<server_instance>/api/stats/all
returns:
{“device_count”:<devices count>, “data_count”:<data count>…. etc}
This would simply run a select query on the <stats_table> to get the set of values and send them as a json string after ensuring that it was from a defined host only and followed a simple shared key authentication, to avoid exposing this unnecessarily to the open internet. - The main web host instance at tinkerbee would run a periodic (hourly) task that would invoke each instance API (as described in 2 above) to get the latest stats from each. It would then sum up the values from each server instance to derive a cumulative set of stats and would write that as a plain json file to a non-exposed folder on the server.
This could have been done many ways, but we chose the good old CRON job to simply run a script every 1 hour. The script would invoke:
https://<server_instance>/api/stats/all
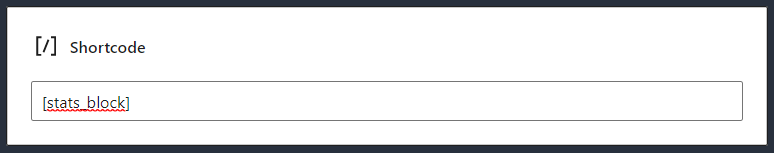
for each defined instance, add up the stats from the returned json and write the stats in a file eg /server/nonwebroot/<stats>/stats.json - Then we had to simply fetch this json, format it and display on wordpress. For this, we had to play around a bit with Admin>Appearance>Theme Editor>functions.php where we,
a. Added a shortcode
add_shortcode( ‘stats_block’, ‘render_stats_block’);
To learn more about WordPress short-codes read:
Shortcode « WordPress Codex
b. Defined the shortcode function
function render_stats_block() {
//get json from file
$file = <file path>;
$json_vals = json_decode(file_get_contents($file),true);
//render vals
return <html for formatting including $json_vals[‘devices’]… etc>;
That’s it!
This is what results in the following being rendered anywhere on our word-press instance (by simply including the block shortcode named ‘stats_block’) as follows: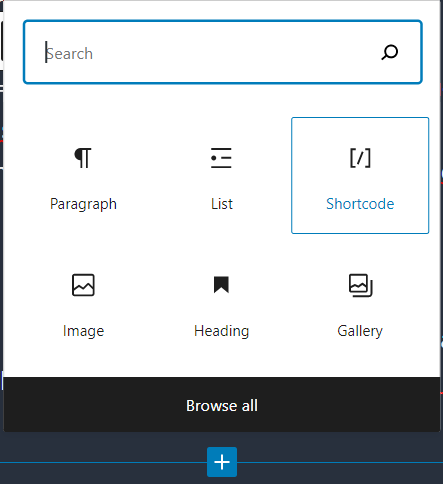
5. Viola! The results:
What you see below is the same (live) rendering of stats fetched automatically from our servers with minimal server load!
We will of course be able to add more parameters in the future to expand on this framework as and when required!